Nature unbound IV – the 2400-year Bray cycle. Part B
In Part A, we established the existence of a ~ 2400-year climate cycle, discovered in 1968 by Roger Bray. This climate cycle correlates in period and phase with a ~ 2400-year cycle in the production of cosmogenic isotopes, that corresponds with clusters of solar grand minima at times of abrupt cooling and climate deterioration. The relationship between solar activity and cosmogenic isotope production during the past centuries confirms the ~ 2400-year solar cycle as the origin of the climate cycle.
The solar variability 2400-year cycle
Radiocarbon dating was developed by Willard Libby in 1952 based on the idea that biological carbon samples that reflected atmospheric 14C/12C proportion at the time they were alive would progressively become 14C depleted due to the isotope’s radioactive decay, and thus would provide a clock to measure elapsed time. But Libby warned that there was no guarantee that the 14C/12C ratio had been constant in time. Therefore, a considerable effort has been ongoing since the 1960s to determine the proportion of 14C in the atmosphere over past millennia. The resulting calibration curve (figure 57) is used to convert radiocarbon dates into real time dates. But the radiocarbon clock does not run at a constant speed as the real-time clock does. There are times when the radiocarbon clock runs faster and times when it runs slower, creating bumps in the calibration curve (figure 57, ovals and arrowheads). That the radiocarbon clock runs faster (Y values decrease faster in figure 57), implies that the 14C/12C ratio is deviating upwards, as samples with more 14C are more recent. This means that either 14C is being produced at a higher rate, or total CO2 is decreasing while 14C is not. Most scientists believe the first explanation contributes more to the observed changes because the proportion of 14C is so small in the atmosphere (~ 10–12) as to require very large changes in total CO2 to produce the alterations that can be explained by small increases in 14C. And we know from ice core records that CO2 changes have been relatively small during the Holocene. A carbon cycle model has been used since the late 1970s to account for the effect of CO2 variations on radiocarbon dating. Thus, the best explanation for the acceleration observed in the radiocarbon clock is that the production rate from cosmic rays in the atmosphere increased due to a decrease in the solar magnetic flux that takes place when the Sun is in a prolonged period of low activity known as a grand solar minimum (GSM). This conclusion is supported by the same variability shown by a different cosmogenic isotope, 10Be, whose deposition does not depend on the carbon cycle.
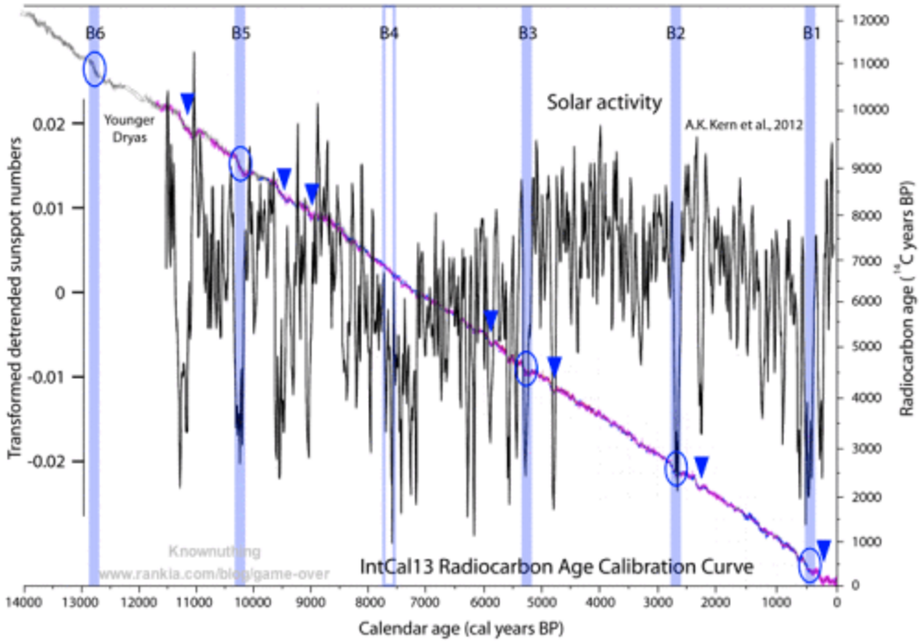
Figure 57. Radiocarbon decay and solar activity. The radiocarbon calibration curve (IntCal13) is unrelated to climate change and obtained through the efforts of hundreds of researchers over decades to provide an accurate way of measuring the time elapsed since a biological sample stopped living. The calibration curve presents periods of time in the past, when there was a noticeable deviation from linearity (ovals and arrowheads). Five of those periods (ovals) are separated by multiples of ~ 2450 years delimitating a 14C cycle. Solar activity reconstruction from cosmogenic 10Be and 14C isotopes shows that those periods correspond to periods of unusually high isotopic production interpreted as grand solar minima like the Spörer and Maunder minima. Those periods correspond precisely to the lows of the Bray climate cycle (blue bars). Source: A.K. Kern et al., 2012. Palaeo. 329–330, 124–136.
From the early 14C production data available in the late 1960s Roger Bray noticed a correspondence between climate change and radiocarbon production (Bray, 1968), thus defining both a climate cycle and a solar variability cycle. This caused him to propose that changes in solar activity were responsible for the climatic changes. The solar cycle can be clearly seen in the radiocarbon data from the ~ 2450 year spacing of higher 14C production at 12800-12650, 10300-10100, 5350-5200, 2800-2650, and 600-400 BP, corresponding to all the Bray lows in the Holocene and Younger Dryas except B4, that lacks a similarly noticeable 14C production signature (figure 57 ovals).
The Bray solar cycle was again identified by J. C. Houtermans in his PhD thesis of 1971, and has since been confirmed multiple times independently. The uncertainty regarding the position of B4, that should fall around 7.8 kyr BP, together with very low solar activity at around 8.3 and 7.3 kyr BP, plus the presence of other periods of very high 14C production between 11.5 and 9 kyr BP (figure 57 arrowheads), has caused different studies to differ in the length of the Bray solar cycle between 2200 and 2600 years depending on the methodology used. The best studies however establish the length of the Bray solar activity cycle between 2400-2500 years, and thus it is commonly referred as the ~ 2400-year cycle. In the late 1980s Sonnet and Damon despite being aware of Bray’s and Houtermans’ studies decided, against established custom, to name the cycle not by the name of its discoverer, but as Hallstattzei (later Hallstatt) for a late Bronze-early Iron cultural transition in an Austrian archeological site during the cycle’s B2 minimum, 2800 years ago. The inappropriateness of a human cultural name from a particular period for a solar cycle that has been acting for tens of thousands, and probably millions of years (Kern et al., 2012), plus the injustice of ignoring its discoverer, demand that the cycle be properly renamed as the Bray cycle.
One peculiarity of the ~ 2400-year solar cycle is that it modulates the amplitude and phase of the ~ 210-year de Vries solar cycle (Sonett, 1984; Hood & Jirikowic, 1990). The amplitude of the de Vries cycle is maximal at the lows of the Bray cycle (figure 58), and minimal at mid-time between lows, to the point of becoming imperceptible.
For the rest of this article please go to source link below.