Irrefutable NASA data: global fires down by 25 percent
Using satellite technology, NASA determined that between 2003 and 2019, global fires have dropped by roughly 25 percent. This makes the “climate change is worsening wildfires” argument completely moot.
The control of fire is a goal that may well be as old as humanity, but the systematic monitoring of fire on a global scale is a much newer capability.
In the 1910s, the U.S. Forest Service began building fire lookout towers on mountain peaks in order to detect distant fires. A few decades later, fire-spotting airplanes flew onto the scene. Then in the early 1980s, satellites began to map fires over large areas from the vantage point of space.
Over time, researchers have built a rich and textured record of Earth’s fire activity and are now able to analyze decadal trends. “The pace of discovery has increased dramatically during the satellite era,” said James Randerson, a scientist at the University of California, Irvine. “Having high-quality, daily observations of fires available on a global scale has been critical.”
The animation above shows the locations of actively burning fires on a monthly basis for nearly two decades. The maps are based on observations from the Moderate Resolution Imaging Spectroradiometer (MODIS) on NASA’s Terra satellite. The colors are based on a count of the number (not size) of fires observed within a 1,000-square-kilometer area. White pixels show the high end of the count—as many as 30 fires in a 1,000-square-kilometer area per day. Orange pixels show as many as 10 fires, while red areas show as few as 1 fire per day.
December 1, 2014 – August 31, 2015
The sequence highlights the rhythms—both natural and human-caused—in global fire activity. Bands of fire sweep across Eurasia, North America, and Southeast Asia as farmers clear and maintain fields in April and May. Summer brings new activity in boreal and temperate forests in North America and Eurasia due to lighting-triggered fires burning in remote areas. In the tropical forests of South America and equatorial Asia, fires flare up in August, September, and October as people make use of the dry season to clear rainforest and savanna, as well as stop trees and shrubs from encroaching on already cleared land. Few months pass in Australia without large numbers of fires burning somewhere on the continent’s vast grasslands, savannas, and tropical forests.
But it is Africa that is truly the fire continent. On an average day in August, the Moderate Resolution Imaging Spectroradiometers (MODIS) on NASA’s Aqua and Terra satellites detect 10,000 actively burning fires around the world—and 70 percent them happen in Africa. Huge numbers of blazes spring up in the northern part of continent in December and January. A half year later, the burning has shifted south. Indeed, global fire emissions typically peak in August and September, coinciding with the main fire seasons of the Southern Hemisphere, particularly Africa. (High activity in temperate and boreal forests in the Northern Hemisphere in the summer also contribute.)
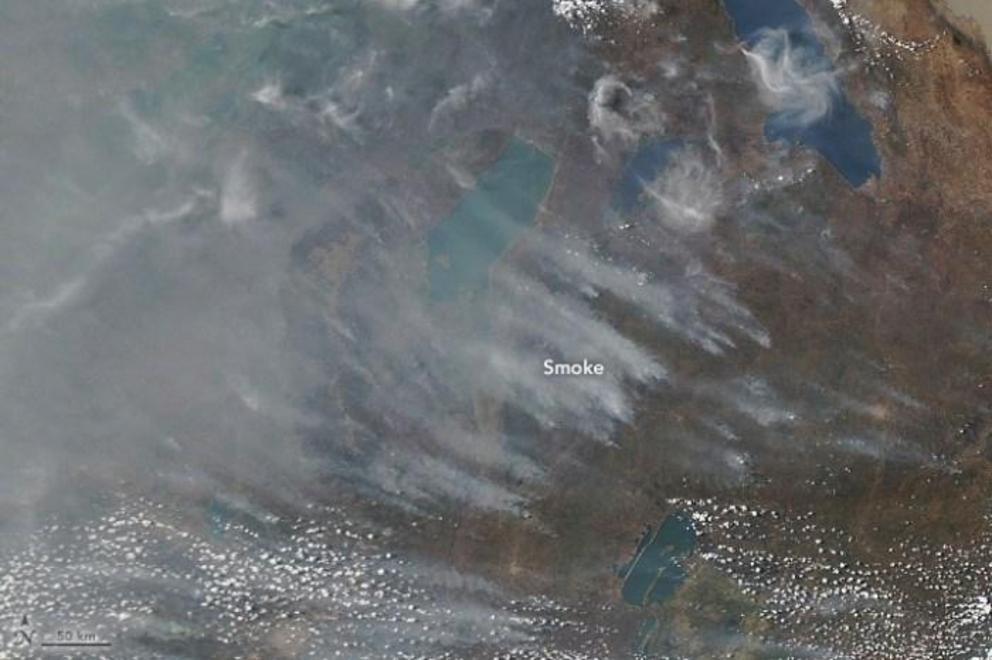
August 29, 2018JPEG
The second animation underscores how much fire activity shifts seasonally by highlighting burning activity during December 2014, April 2015, and August 2015. The satellite image above shows smoke rising from the savanna of northern Zambia on August 29, 2018, around the time global emissions reach their maximum.
Though Africa dominates in the sheer number of fires, fires seasons there are pretty consistent from year-to-year. The most variable fire seasons happen elsewhere, such as the tropical forests of South America and equatorial Asia. In these areas, the severity of fire season is often linked to cycles of El Niño and La Niña. The buildup of warm water in the eastern Pacific during an El Niño changes atmospheric patterns and reduces rainfall over many rainforests, allowing them to burn more easily and widely.https://www.youtube.com/embed/69N494UIlS8?flag=1&enablejsapi=1&html5=1&origin=https://earthobservatory.nasa.gov
Despite the vast quantities of carbon released by fires in savannas, grasslands, and boreal forests, research shows that fires in these biomes do not generally add carbon to the atmosphere in the long term. The regrowth of vegetation or the creation of charcoal typically recaptures all of the carbon within months or years. However, when fires permanently remove trees or burn through peat (a carbon-rich fuel that can take centuries to form), little carbon is recaptured and the atmosphere sees a net increase in CO2.
That is why outbreaks of fire in countries with large amounts of peat, such as Indonesia, have an outsized effect on global climate. Fires in equatorial Asia account for just 0.6 percent of global burned area, yet the region accounts for 8 percent of carbon emissions and 23 percent of methane emissions. On October, 25, 2015, the Earth Polychromatic Imaging Camera aboard the DSCOVR satellite acquired an image (below) of heavy smoke over Indonesia; El Niño was particularly active at the time.
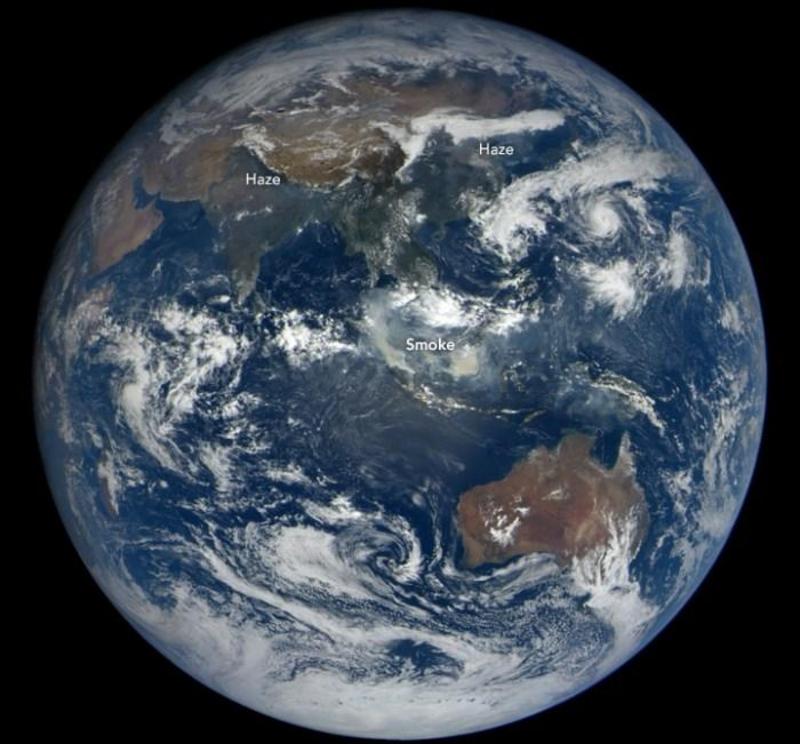
October 15, 2015
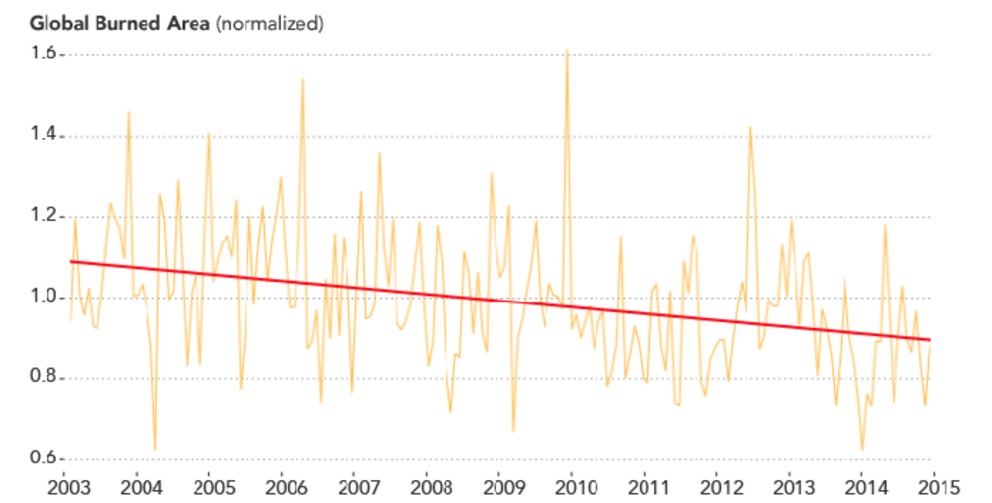
One of the most interesting things researchers have discovered since MODIS began collecting measurements, noted Randerson, is a decrease in the total number of square kilometers burned each year. Between 2003 and 2019, that number has dropped by roughly 25 percent.
As populations have increased in fire-prone regions of Africa, South America, and Central Asia, grasslands and savannas have become more developed and converted into farmland. As a result, long-standing habits of burning grasslands (to clear shrubs and land for cattle or other reasons) have decreased, explained NASA Goddard Space Flight scientist Niels Andela. And instead of using fire, people increasingly use machines to clear crops.
“There are really two separate trends,” said Randerson. “Even as the global burned area number has declined because of what is happening in savannas, we are seeing a significant increase in the intensity and reach of fires in the western United States because of climate change.”
2003 – 2015
When researchers began using satellites to study the world’s fires in the 1980s, they were just sorting out the basics of how to detect fires from space. Now after mining MODIS data for nearly two decades, scientists are looking ahead to other satellites and technologies that they hope will advance the study of fire in the coming years.
A series of follow-on sensors called the Visible Infrared Imaging Radiometer Suite (VIIRS) on the Suomi NPP and NOAA-20 satellites now make near-real time observations of emissions that are even more accurate than those from MODIS because of improved fire detections along the edge of the edges of images, noted Andela.
Meanwhile, the launch of satellites with higher-resolution sensors is also helping. “The Landsat 8 and Sentinel satellites, in particular, are contributing to a revolution in our ability to measure the burned area of small grassland and forest fires,” said Randerson. “And we are going to need additional detection capabilities in the coming years to track increasingly destructive mega fires during all times of day and night.”
References & Resources
- Andela, N. et al. (2017) A human-driven decline in global burned area. Science, 356 (6345), 1356-1362.
- Chen, Y. et al. (2017) A pan-tropical cascade of fire driven by El Niño/Southern Oscillation. Nature Climate Change, 7, 906-911.
- Giglio, L. et al. (2006) Global distribution and seasonality of active fires as observed with the Terra and Aqua Moderate Resolution Imaging Spectroradiometer (MODIS) sensors. Journal of Geophysical Research: Biogeosciences 111, G2.
- Giglio, L. et al. (2006) Global estimation of burned area using MODIS active fire observations. Atmospheric Chemistry and Physics 9, 957-974.
- Jones, S. et al. (2017) Advances in the Remote Sensing of Active Fires: A Review. Accessed August 20, 2019.
- Korontzi, S. et al. (2006) Global distribution of agricultural fires in croplands from 3 years of Moderate Resolution Imaging Spectroradiometer (MODIS) data. Global Biogeochemical Cycles, 2 (20).
- NASA Earthdata (2019, August 7) Wildfires Can’t Hide from Earth Observing Satellites. Accessed 20, 2019.
- Turetsky, M. et al. (2015) Global vulnerability of peatlands to fire and carbon loss. Nature Geoscience, 8, 11-14.
- Van der Werf, G. et al. (2017) Global fire emissions estimates during 1997-2016. Earth Syst. Sci. Data, 9, 697-720.